This white paper is the second in a series designed to bring our understanding of the US equity market to the next level. It is best read after its predecessor, “Overview of the Work,” and in particular the overview’s introduction and first section, which focus on recasting the earnings track record. What follows here builds on those and lays out the supporting evidence for their findings, along with much more detail. This paper is organized into two parts, the first and longer part focusing on CAPE-based valuations and the second, shorter part focusing on corporate profit margins. Taken together, the two parts address both the multiple and the earnings side of equity prices.
Part One overview: CAPE-based valuations
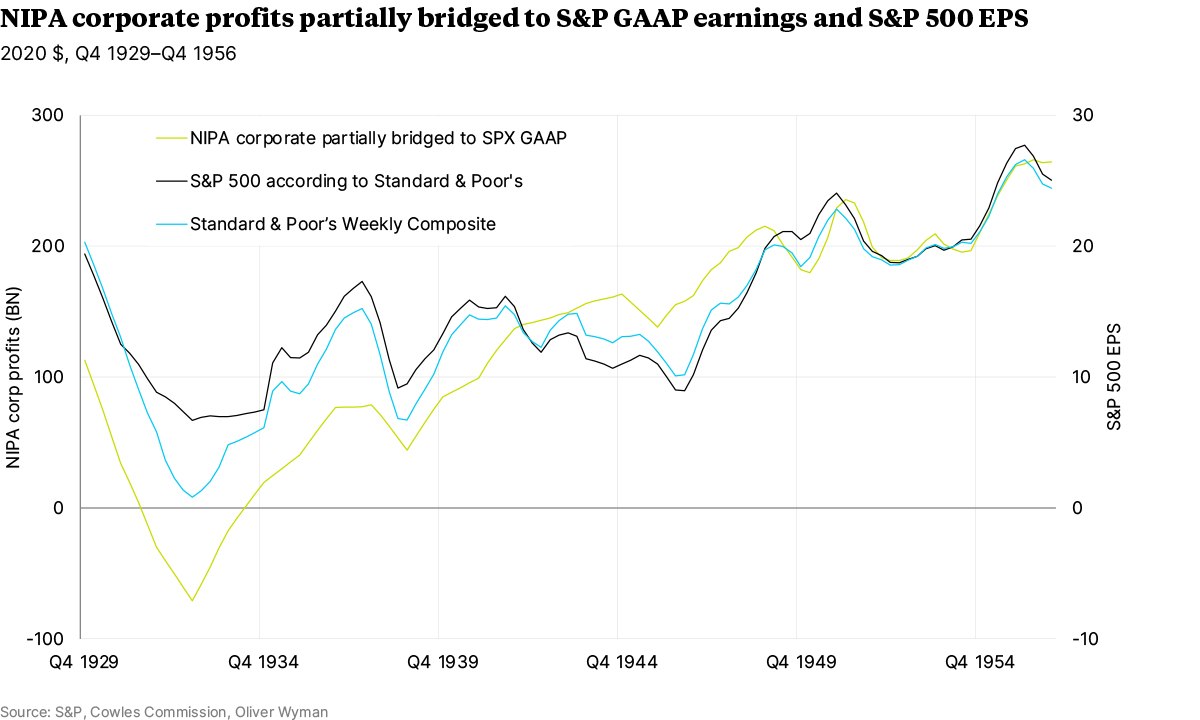
The main objective of Part One of this paper is to show how we ensure that both the earnings and price data necessary to compute valuations are as good and consistent as possible. First, we improve the quality of the S&P 500 earnings and price data. Next, we recast accounting practices, which have changed radically since 1871, to a single consistent standard. We also adjust for dispersion. And we replace earnings based on generally accepted accounting principles, or GAAP, with what Warren Buffett calls “owner earnings.” Finally, we subtract investor personal taxes. After those necessary adjustments, we conclude that pre-COVID-19[1] valuations based on the cyclically adjusted price/earnings multiple, or CAPE, were elevated rather than extreme. By contrast, June 2021 valuations were very high, but we will show in the third white paper that they were broadly commensurate with unprecedentedly low interest rates and the below-average risk aversion at that time.
We organize Part One around five questions:
- How to improve the dataset for the period before the creation of the Standard & Poor’s 500 index in March 1957, and particularly for the pre-World War II period?
- How has GAAP varied over time, and how to adjust the dataset to correct for the variations so as to ensure consistency?
- How to calculate dispersion?
- How to convert GAAP earnings into owner earnings?
- And, finally, how to handle the thorny issue of investor dividend and capital gains taxes, given the wide fluctuations in tax policy throughout the period?
We conclude by considering the implications on CAPE-based valuations.
These five questions are all highly technical. As a result, the first part of this paper is particularly detail oriented. Yet it is this intense attention to detail that allows us to recast the historical track record and put it on a consistent and economically sound footing.
Our results shift the landscape: The existing literature has identified a number of issues challenging the conclusions of the CAPE method made famous by Nobel Prize-winning economist Robert Shiller and others. We address them in Section 2 of Part One and in Appendix B, and we show that their impact is in fact marginal. By contrast, the issues we address in the other sections of Part One of this white paper have rarely, if ever, been mentioned in the literature, yet have a highly significant impact.
Part Two overview: Corporate profit margins
Part Two focuses on bringing to light the corporate profit margin record. To set the context, we reproduce verbatim below the relevant part of the first white paper of this series.
Secular profit margins before corporate taxes are near an 80-year high;[2] the combined corporate and personal tax rate is near an 80-year low; and the margins after all taxes are near a 100-year high.
We assess the dynamics of the rise of pre-all-tax secular margin qualitatively. The results are not surprising. The main drivers are the increased concentration of key industries, the favorable regulatory environment, the benign labor market cost pressures in recent decades, the positive commodity supercycle environment, and the improvement in management quality.
The combined corporate and investor personal taxes are driven by the amount of tax to be collected and the progressivity of the tax system. We note that beliefs about appropriate taxation policy have varied widely over time.
We organize Part Two around four topics: improvements in management quality, other pre-tax factors, changes in tax policy, and apportionment of the margin increase among its three factors.
Download Paper 2
[1] Between 2017 and 2019; 2] Margins including cyclical components peaked in 2019.