Is the stock market overvalued, undervalued, or just right?
It is a question that has bedeviled investors, economists, and business leaders for centuries. Bold thinkers throughout history have devoted enormous amounts of brainpower to the subject. Six scholars have been awarded the Nobel Prize in Economic Sciences for developing models that have brought mankind closer to an understanding of equity market behavior. These and other models have become bedrock principles of finance and cornerstones of modern investing practice.
And yet no model or method on its own has satisfactorily answered the question. Each has an Achilles heel — some small flaw that renders the exercise frustratingly incomplete. That’s partly because, in order to fully understand all of the variables affecting equity markets, investigators must bring to bear a much broader set of skills than is commonly recognized. They must possess not only a deep knowledge of traditional finance but also accounting principles, analytics, macro- and microeconomics, history, sociology, and psychology. They must be intellectually unfettered and radically holistic.
Initially we set out to solve the eternal puzzle of stock market valuation by examining one of the most popular benchmarks, the cyclically adjusted price/earnings ratio (CAPE) popularized by Yale Prof. Robert Shiller and others. Before long, we realized there are many more forces driving the equity market that require new attention. Our vantagepoint as curious outsiders rather than hidebound practitioners has given us the freedom to assume nothing, to question everything, and to discard the shibboleths of the past without sentimentality.
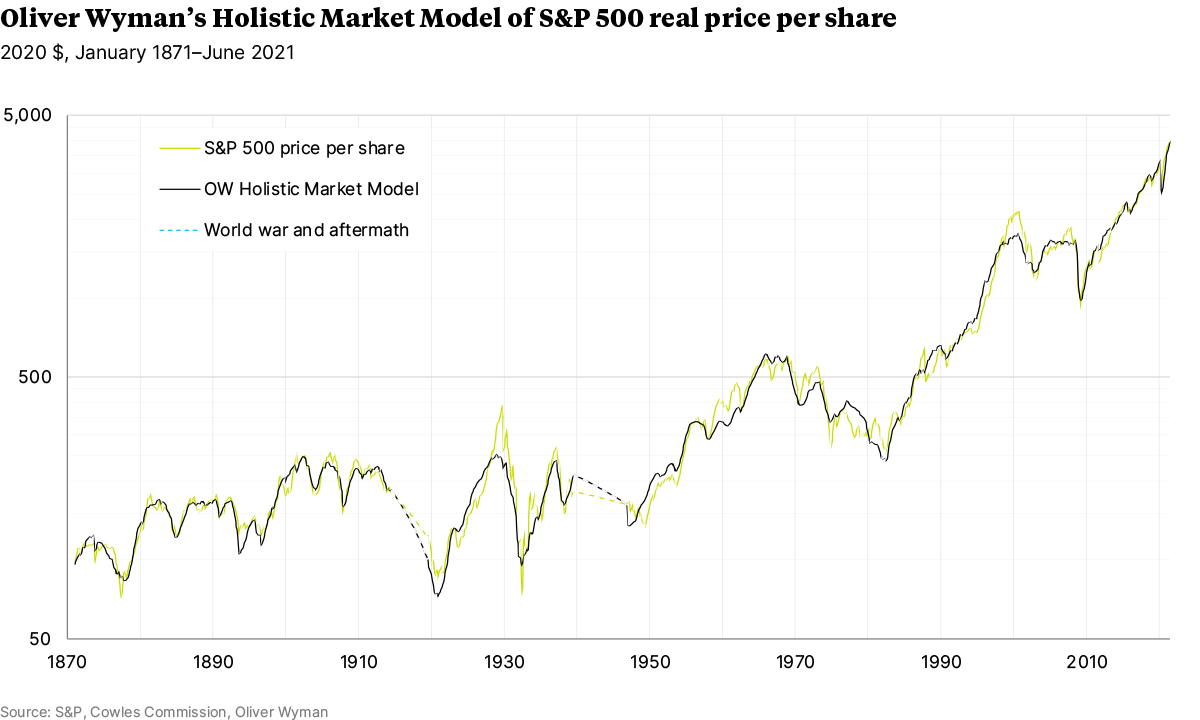
Among our achievements, we have produced a new model that explains more thoroughly than any before it the US equity market’s behavior over the past century and a half. We call it the Holistic Market Model, or HMM. The first white paper in the series summarizes our ground-breaking findings. Here, we break down our nine key observations in laymen’s terms and provide context for their historical relevance. The first six are sequential steppingstones to the seventh and eighth, the HMM. In turn, the HMM’s “what-if” capability underpins our ninth finding, providing a superior way of framing future uncertainty.
Finding 1: Equity market valuations just before COVID-19 were elevated, but they weren’t extreme. The price/earnings ratio is a commonly used method to value both individual stocks and the market as a whole. But the “E” in the P/E ratio can be slippery, because corporate earnings results are often volatile in the short-term. So many analysts prefer a cyclically adjusted P/E, such as the Shiller CAPE, that considers 10 years’ worth of earnings results across the entire stock market. Tracking that figure over time provides a sense of how stocks are valued at any particular moment relative to their long-term average. (The Shiller CAPE was at an extreme level just before COVID-19.) To be sure, these methods represented a major step forward in valuing the market — but they suffer from incompleteness. For instance, while they rely on corporate earnings over the past 150 years, they don’t allow for the reality that accounting methods have changed significantly over that period. Likewise, levels of personal taxation have varied greatly over time, affecting valuations. When adjusting for these and other factors, we find that just before COVID-19, CAPE-based market valuations were indeed elevated, but not extreme. In contrast, market valuations were very high in June 2021, but were broadly commensurate with unprecedentedly low interest rates and below-average risk aversion.
Finding 2: Corporate profit margins are at historically high levels. In our work we examined not only the absolute level of corporate earnings but also revenues, in order to determine profit margins. We found, to our surprise, that secular corporate profit margins are near a 100-year high. There are numerous reasons for this, one of which is that business managers, like doctors and engineers, have simply gotten better at their craft over time.
Finding 3: It is possible to create a market-wide P/E ratio that is both real-time and low-volatility. It is easy to gauge the valuation of a physical commodity such as, for example, a hog, which can be weighed and sold at a price per pound. Equities aren’t so simple. Most investors use corporate earnings as the weighting mechanism and derive a P/E ratio. As we noted earlier, earnings, unlike a hog’s weight, are volatile; during recessions, earnings might even go negative. To combat that volatility, researchers have used longer periods of earnings, such as a decade, to smooth out the fluctuations. But that creates another problem: lag. Earnings levels 10 years ago might have little relevance to what’s happening now, and companies can look more or less profitable as the results from a decade earlier fall out of the calculation window (such as, say, banks from 2009 to 2019). What’s more, as the composition of the index changes, many of the companies aren’t the ones that were there to start with. We have found a way to solve both the volatility problem and the lag-time problem through a new approach we call “perceived earnings.” It shows that earnings drive more of the market’s behavior than most people realize, and the market is therefore more efficient than commonly assumed.
Finding 4: The Capital Asset Pricing Model, or CAPM, works — but only if you apply it correctly. The CAPM is one of the great building blocks of financial analysis. But to make it function properly two major adjustments are needed. First, one needs to address head-on the fact that inflation affects equities and Treasury bonds in very different ways. Second, while the Treasury bond is practically default-risk free, it embeds both inflation expectations and multiple non-default-related risks. Treasury bonds are therefore far from “riskless.” This has to be addressed as well.
Finding 5: Many valuation models assume the “equity risk premium” is a constant, but in fact it is highly variable and is driven by four individual factors. The traditional equity risk premium is the amount of compensation an investor demands for taking the risk of holding a stock rather than a Treasury bond. But we have already established that the Treasury bond isn’t truly risk-free. Therefore, the trade-off between the risk of a stock and a “riskless” Treasury bond is in a sense a false choice, since both carry risks. Having controlled for the risk of the Treasury bond and the problem of comparing bonds, which are nominal assets, with equities, which are real assets, we found that there are four factors that determine what we call the “true north” equity risk premium. Some of them are extremely short-term; risk-aversion (via a flight to safety) is a prime example because it can drive investor behavior in a matter of minutes, such as right after a terrorist attack. At the other end of the time continuum, some factors are generational in scope, such as the degree of aversion to stocks of people who grew up during the Great Depression that they then passed on to their children. A valuation model that doesn’t consider these factors in developing an understanding of the broader “true north” equity risk premium is incomplete.
Finding 6: There is a way to explain market behavior using only the tools of 19th century classical economics. The field of finance has applied ever-increasing levels of sophistication to the question of stock market valuation. But what if the main drivers of equity prices across the market were simple supply and demand? We have found, quite iconoclastically, that modern finance isn’t needed to explain aggregate stock prices. Over time the demand for stocks has increased as pension programs evolve, as more wealth has flowed to the top of the economic ladder, and for other reasons. At the same time, the supply of shares has remained fairly steady, particularly after the 1982 law allowing companies to buy back their shares. We created a simple Supply/Demand Balance Model that bypasses questions of corporate earnings, risk premia, and all the rest of the modern finance toolkit — and it turned out to be just as accurate. Equity prices are high nowadays because society has trained people to want “equities for the long term,” there is a lot of investing power at the top of the income pyramid, and the supply of shares is fairly low. It’s really as simple as that.
Finding 7: A holistic approach is essential when considering stock market valuation because there are numerous factors driving behavior. The HMM is the successor to the CAPM because it answers three questions instead of one. The CAPM seeks to determine the return an investor should expect for the amount of risk being taken. The HMM addresses much more. First, what is the supply/demand balance for financial assets? Second, what are the market shares of the competing asset classes — namely, equities, bonds, and cash? And third, what is the price differential between these asset classes? Say Coke is a stock and Pepsi is a bond. The CAPM tells you only what the price differential between the two should be. The HMM worries about that last. First, it determines the size of the carbonated beverage market. Next, it inquires about why Coke might have a higher market share; if Coke increases advertising, what will happen? This approach allows an investor to avoid having to posit that Pepsi is the basis against which Coke should be valued and addresses a broader set of factors.
Finding 8: The HMM shows that equity prices have been high in recent years not because of rampant speculation but because of historically unusual and favorable conditions. The US equity market has benefitted from a confluence of forces that have allowed for appreciation in recent years — a favorable supply/demand balance, Goldilocks inflation, benign Federal Reserve policies such as quantitative easing, and favorable regulatory and tax environments. Some of these forces are locked in for the long term, but others are much less of a sure thing.
Finding 9: To conclude that equities will return to their baseline historical price trend over the long term is not only foolish but potentially dangerous. The forces driving equity market performance ebb and flow at their own pace. Sometimes the conditions create a perfect confluence, like a solar eclipse, but at other times that confluence breaks down. There is no such thing as “normal.” Will the supply/demand balance for financial assets loosen? Will inflation remain in the Goldilocks range associated with strong equity returns? Will the regulatory and tax environment that have been favorable to equity ownership continue? The HMM shows that these are the questions that will determine the equity market’s performance in the future — not some mythical invisible hand guiding the equity market toward its long-term historical average.
In the course of the five white papers that follow, we will show the work that led to these nine findings. Each of them is important in its own right. Taken together, they bring our understanding of the forces driving equity prices to the next level. Academics will be most interested in the reinvention of the CAPM into the much broader HMM. Treasury and Fed officials will be most interested in the quantification of the linkage between tax and monetary policy and equity prices. Investors and money managers will focus on how these findings can help them position their portfolios more skillfully by framing future uncertainty better.